
Northwestern REU
This project was completed during the summer 2025 Northwestern University REU at the Center for Interdisciplinary Exploration and Research in Astrophysics (CIERA).

Poster
iPoster for January 2026 AAS Conference
Abstract
This exploratory study examines the relationships between the emission line spectra of galaxies and their morphological properties to determine whether any correlations exist between the gas properties of HII regions and the physical characteristics of galaxies. We utilize recent JWST NIRSpec spectroscopic data in three bands to compute emission line flux ratios. We examine two BPT diagrams showing the relationship between the $[OIII]λ5007/Hβ$ emission line ratio and both the $[NII]λ6584/H⍺$ and $[SII]λ6717 + 6731/H⍺$ line ratios, respectively. We also examine two more emission line relationships: between the [OIII]λ5007/[OII]λ3729 and the [SIII]λ9531/[SII]λ 6717 + 6731 emission line ratios, and between the $[OIII]λ5007 / [OII]λ3729$ and the $([OIII]λ5007 + [OII]λ3729)/Hβ$ emission line ratios. We study the connections between these emission line diagnostics and emission line diagrams with several morphological properties and physical parameters: the effective radius $R_eff$ and mass of each galaxy, a measure of how compact/extended a galaxy is that we define as $Δlog(R_{eff})$, each galaxy’s Sérsic index, and the electron density of each galaxy. We find there is a negative relationship between electron density and $Δlog(R_{eff})$. We present two possible solutions for the small number of correlations found: either there are not many correlations between the physical conditions of HII regions and the morphology of galaxies, or we are not yet examining properties that correlate.
Introduction
A galaxy’s spectrum is created by studying the galaxy’s light after it has been dispersed into its component wavelengths. The emission lines present in a spectrum tell us incredible amounts of information about the physical processes within a galaxy, such as the rates of star formation within the galaxy, the galaxy’s temperature and density, the amount and types of gas and dust in the galaxy, and more. Many of the strong lines we see in galaxy spectra come from HII regions, which are regions of space where hydrogen gas has been ionized by nearby stars. By taking flux ratios of emission line pairs close in wavelength, we can minimize the effects of dust extinction.
The purpose of this study is to compare the results of these emission line diagnostics to morphological measurements of these galaxies. We examine the relationships between the aforementioned emission line ratios with several morphological properties: the effective radius $R_{eff}$, which is the radius of a galaxy that contains half of its light (M. Vika et al. 2015), a measure of how compact/extended a galaxy is, each galaxy’s S'ersic index, and with the electron density of each galaxy.
The data used for this study was sourced from the Dawn James Webb Space Telescope (JWST) Archive, which is a repository of public JWST galaxy data (A. de Graaff et al. 2025) (K. E. Heintz et al. 2024). The spectroscopic data was gathered by JWST’s Near-Infrared Spectrograph (NIRSpec) (P. Jakobsen et al. 2022) across three bands (G140, G235, G395).
Methods
The morphology of each galaxy in the sample was analyzed using eight JWST images of the galaxy (A. de Graaff et al. 2025) (K. E. Heintz et al. 2024). From these images, the redshift $z$ and mass (measured in solar masses (M_\odot)) were measured. Profiles were then fit to galaxies using the pysersic code de (I. Pasha & T. B. Miller 2023). Throughout this process, each galaxy was assumed to follow a S'ersic profile (J. L. Sersic 1968). The S'ersic index, a number representing the shape of the galaxy’s light distribution, was then measured for each galaxy. Each of the eight JWST images measured slightly different $R_{eff}$ and S'ersic index values, so these $R_{eff}$ and S'ersic index values were then interpolated to the rest frame wavelength of $5000Å$ using SciPy’s B-Spline interpolation software (P. Virtanen et al. 2020). The observed size of galaxies correlates with both masses and redshift. This means that if we compare the galaxy size directly to the line ratio, it would be difficult to decipher whether any connections are due to differences in size or due to correlations with mass and redshift. To remove these confounding effects, a model was fit to describe the average size of a galaxy as a function of radius, mass, and redshift.
To analyze the emission line spectra of each galaxy, each spectrum was moved into rest-frame wavelengths and had its continuum removed. An SNR-based Gaussian emission line fitting method line was utilized, and if the same emission line was detected across multiple bands, the band with the highest SNR was utilized. Several tests were performed in order to ensure the accuracy of this fitting method, including plotting the root-mean-squared of each galaxy spectra in each band and comparing the flux of the same emission line in the same galaxy across multiple bands.
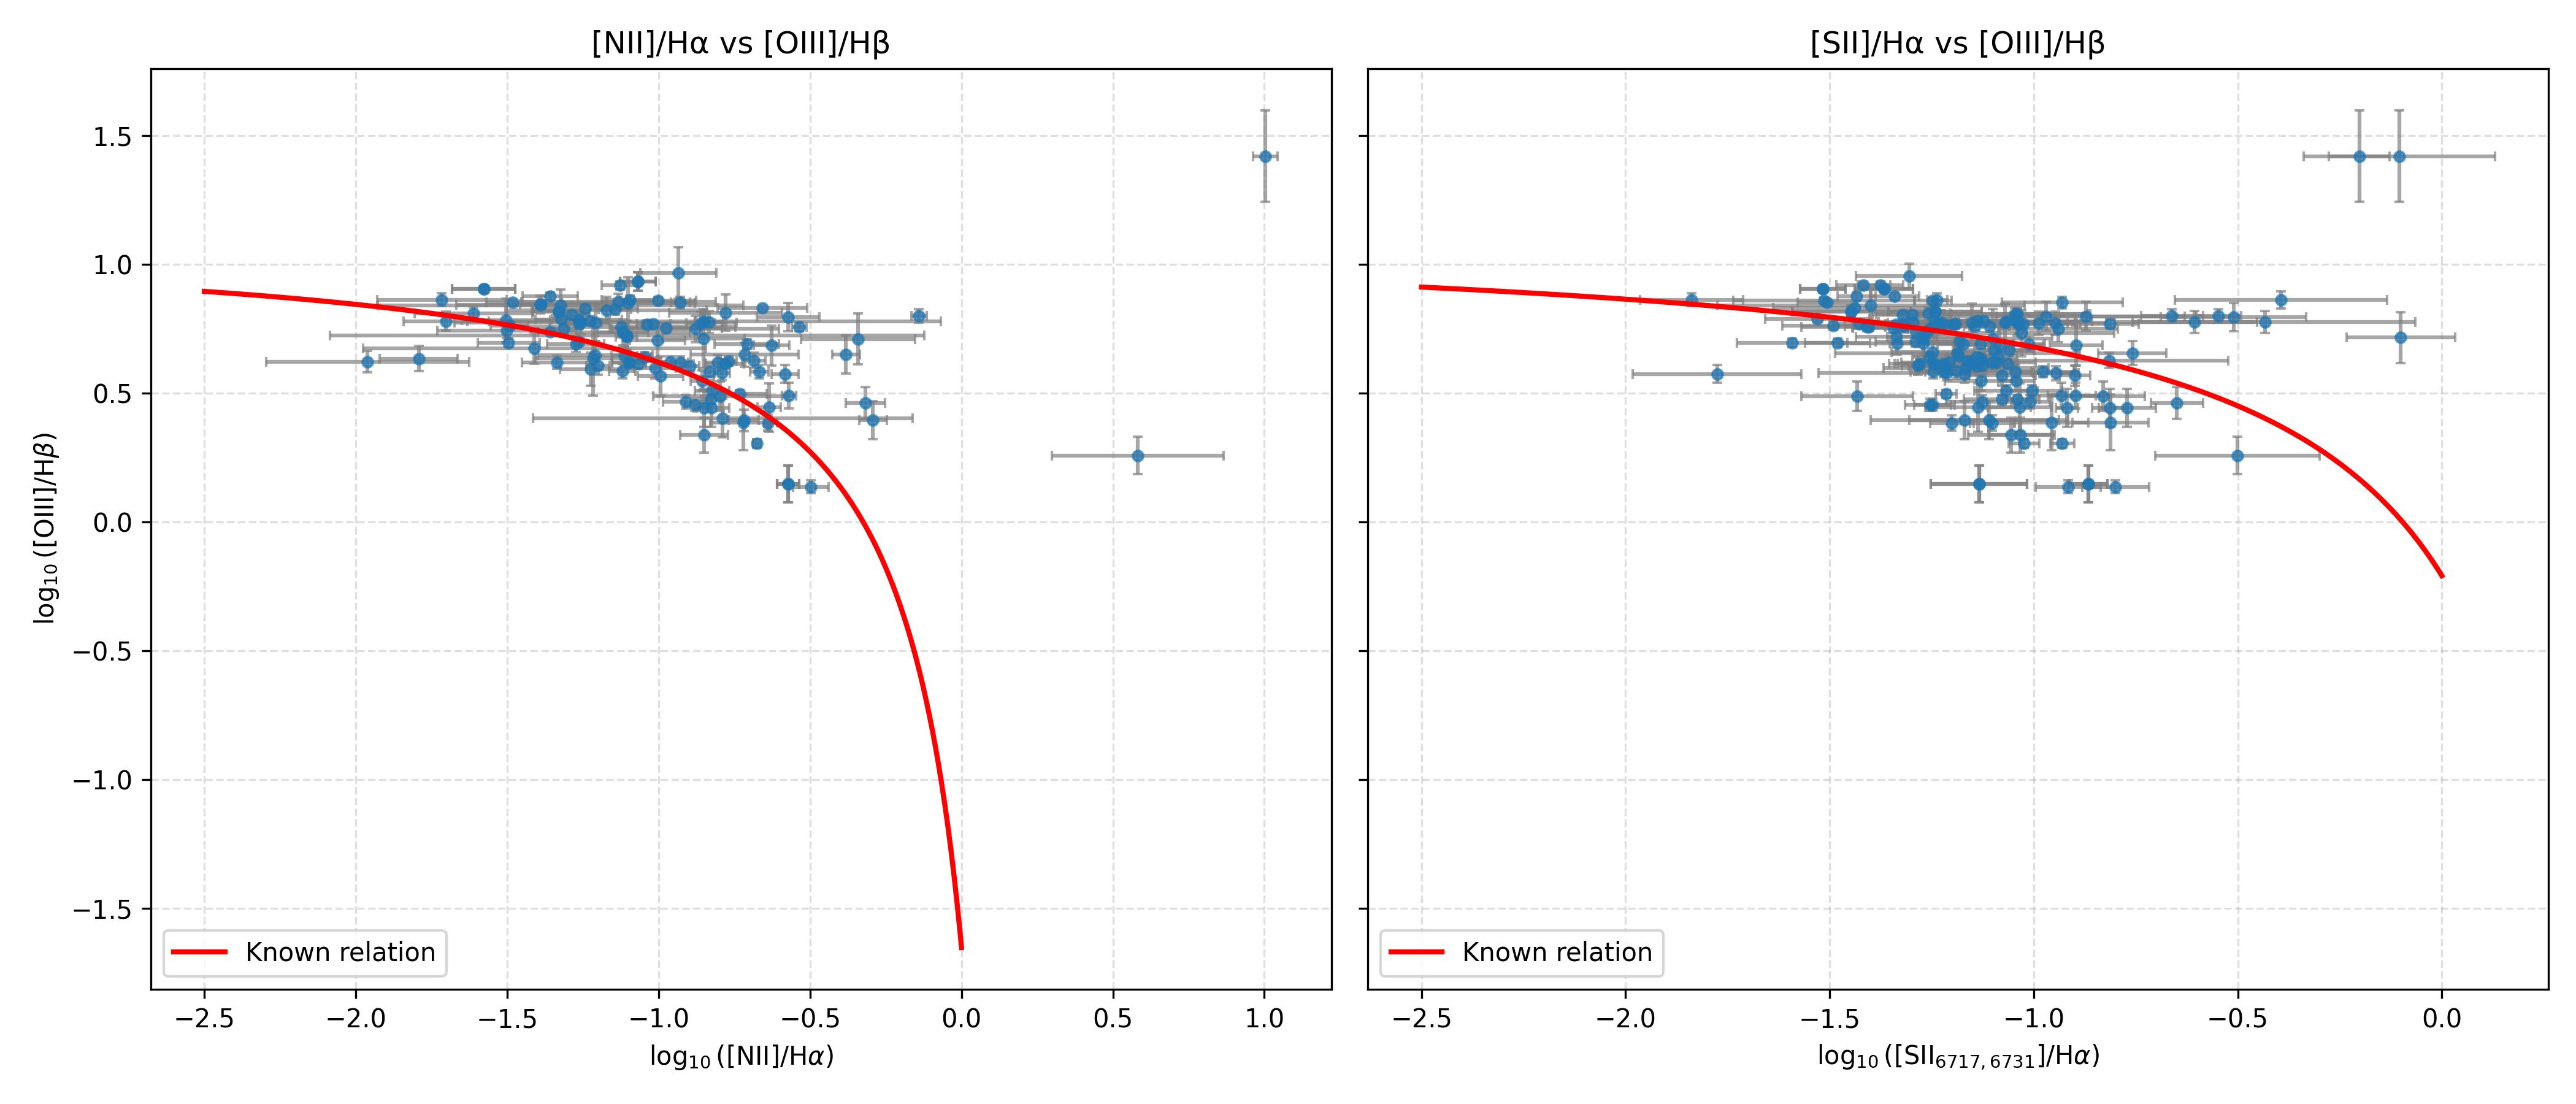
Four emission line ratio diagrams were created for this study, two of them being BPT diagrams (J. A. Baldwin et al. 1981). Although the original purpose of BPT diagrams were to find AGNs, now they are commonly used to investigate the properties of the gas within galaxies. The two BPT diagrams included in the study compared the $[OIII]\lambda 5007/H\beta$ emission line ratio to either the $[NII]\lambda 6584/H\alpha$ ratio (N2-BPT) or the $[SII]\lambda 6717 + 6731/H\alpha$ ratio (S2-BPT). The two other emission line ratio diagrams created for this study compared the $[OIII]\lambda 5007 / H\beta$ emission line ratio to each the $[SIII]\lambda 9531/[SII]\lambda 6717,6731$ and the $[([OIII]\lambda 5007+[OII]\lambda 3729)/H\beta$ emission line ratios (O32-R23). For the S32 and the O32-R23 diagrams, the emission lines in each ratio are much farther apart than in the N2-BPT and S2-BPT diagrams. This means that dust reddening effects are present in these diagrams, especially for the O32 and the S32 ratios. The PyNeb code was utilized to remove these dust reddening effects ects (V. Luridiana et al. 2015), and then these results were compared to similar plots from A. L. Strom et al. (2017) to verify their accuracy. The created N2- and S2-BPT diagrams can be seen in Fig. 1., overlaid with known $[OIII]/H\beta$ relationships from A. L. Strom et al. (2017) overlaid as a comparison.
Results
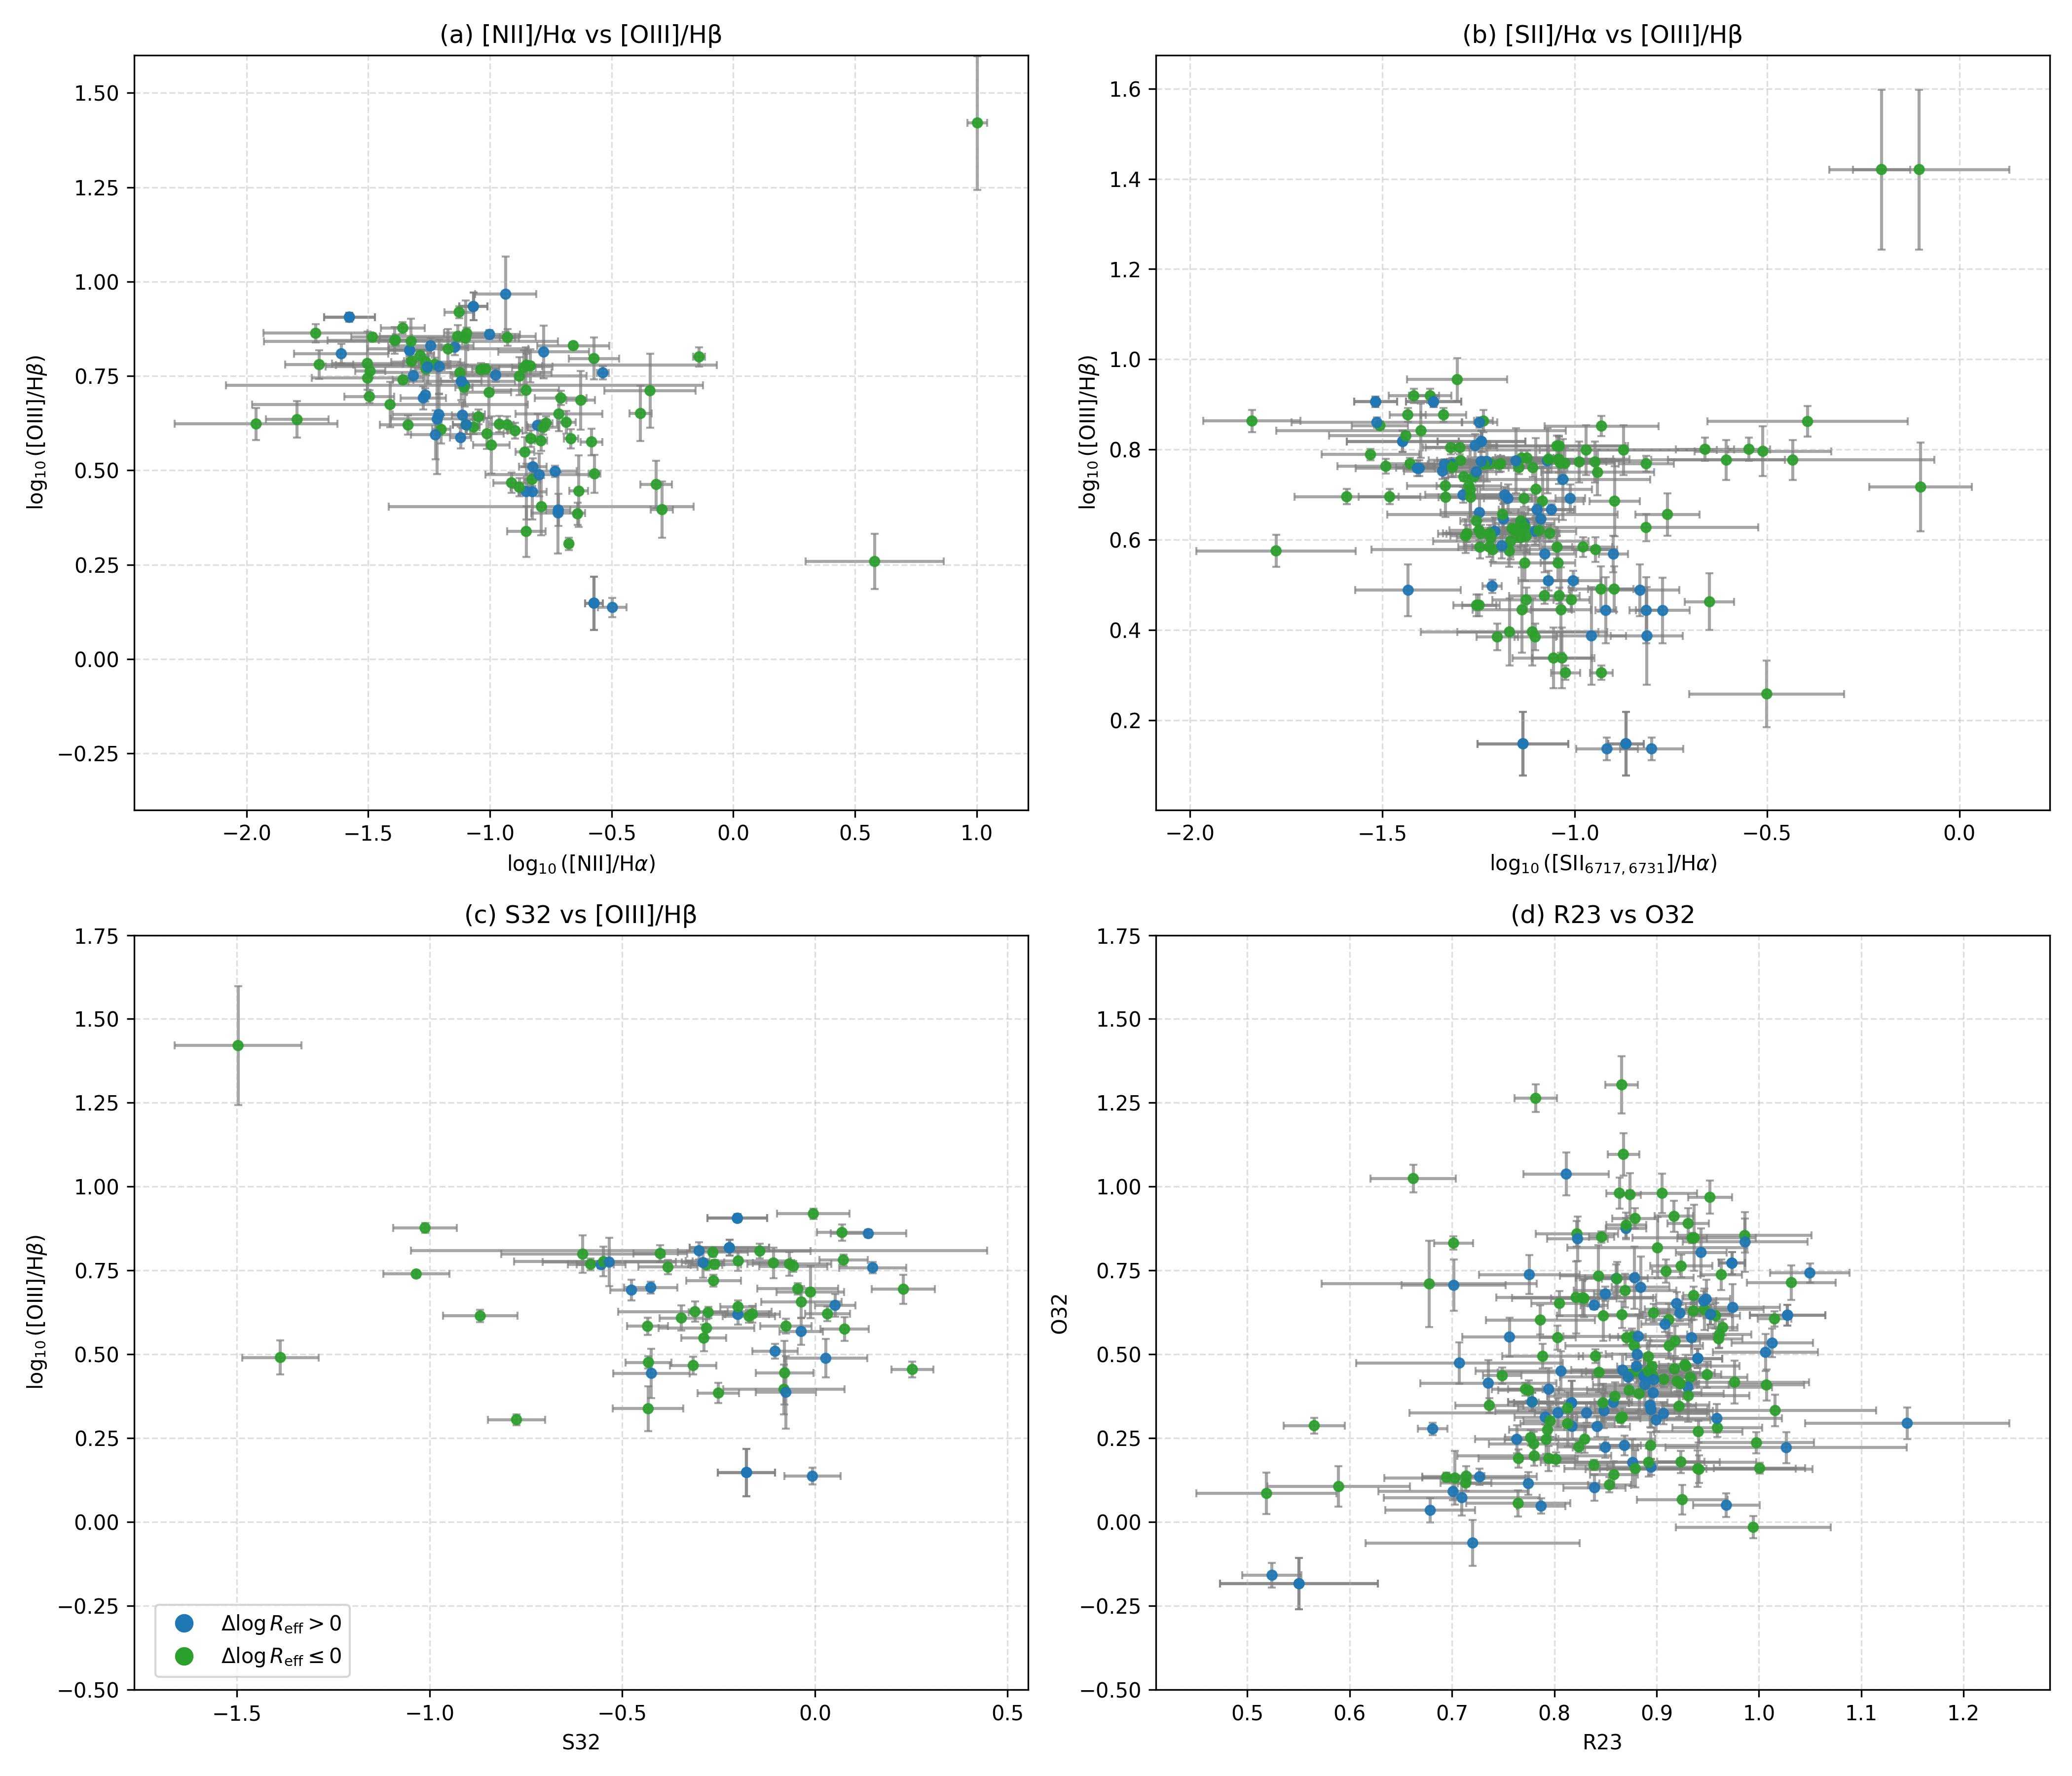
The first relationship we explored was between a galaxy’s $\Delta log(R_{eff})$, meaning how extended/compact the galaxy is, and the emission line diagnostics. We began by recreating each emission line ratio diagram, coloring the data points blue if $\Delta log(R_{eff}) > 0$ and green if $\Delta log(R_{eff}) < 0$. These plots are seen in Figure 2. We did not find any significant difference in scatter between the different $\Delta log(R_{eff})$ values for any of these plots.
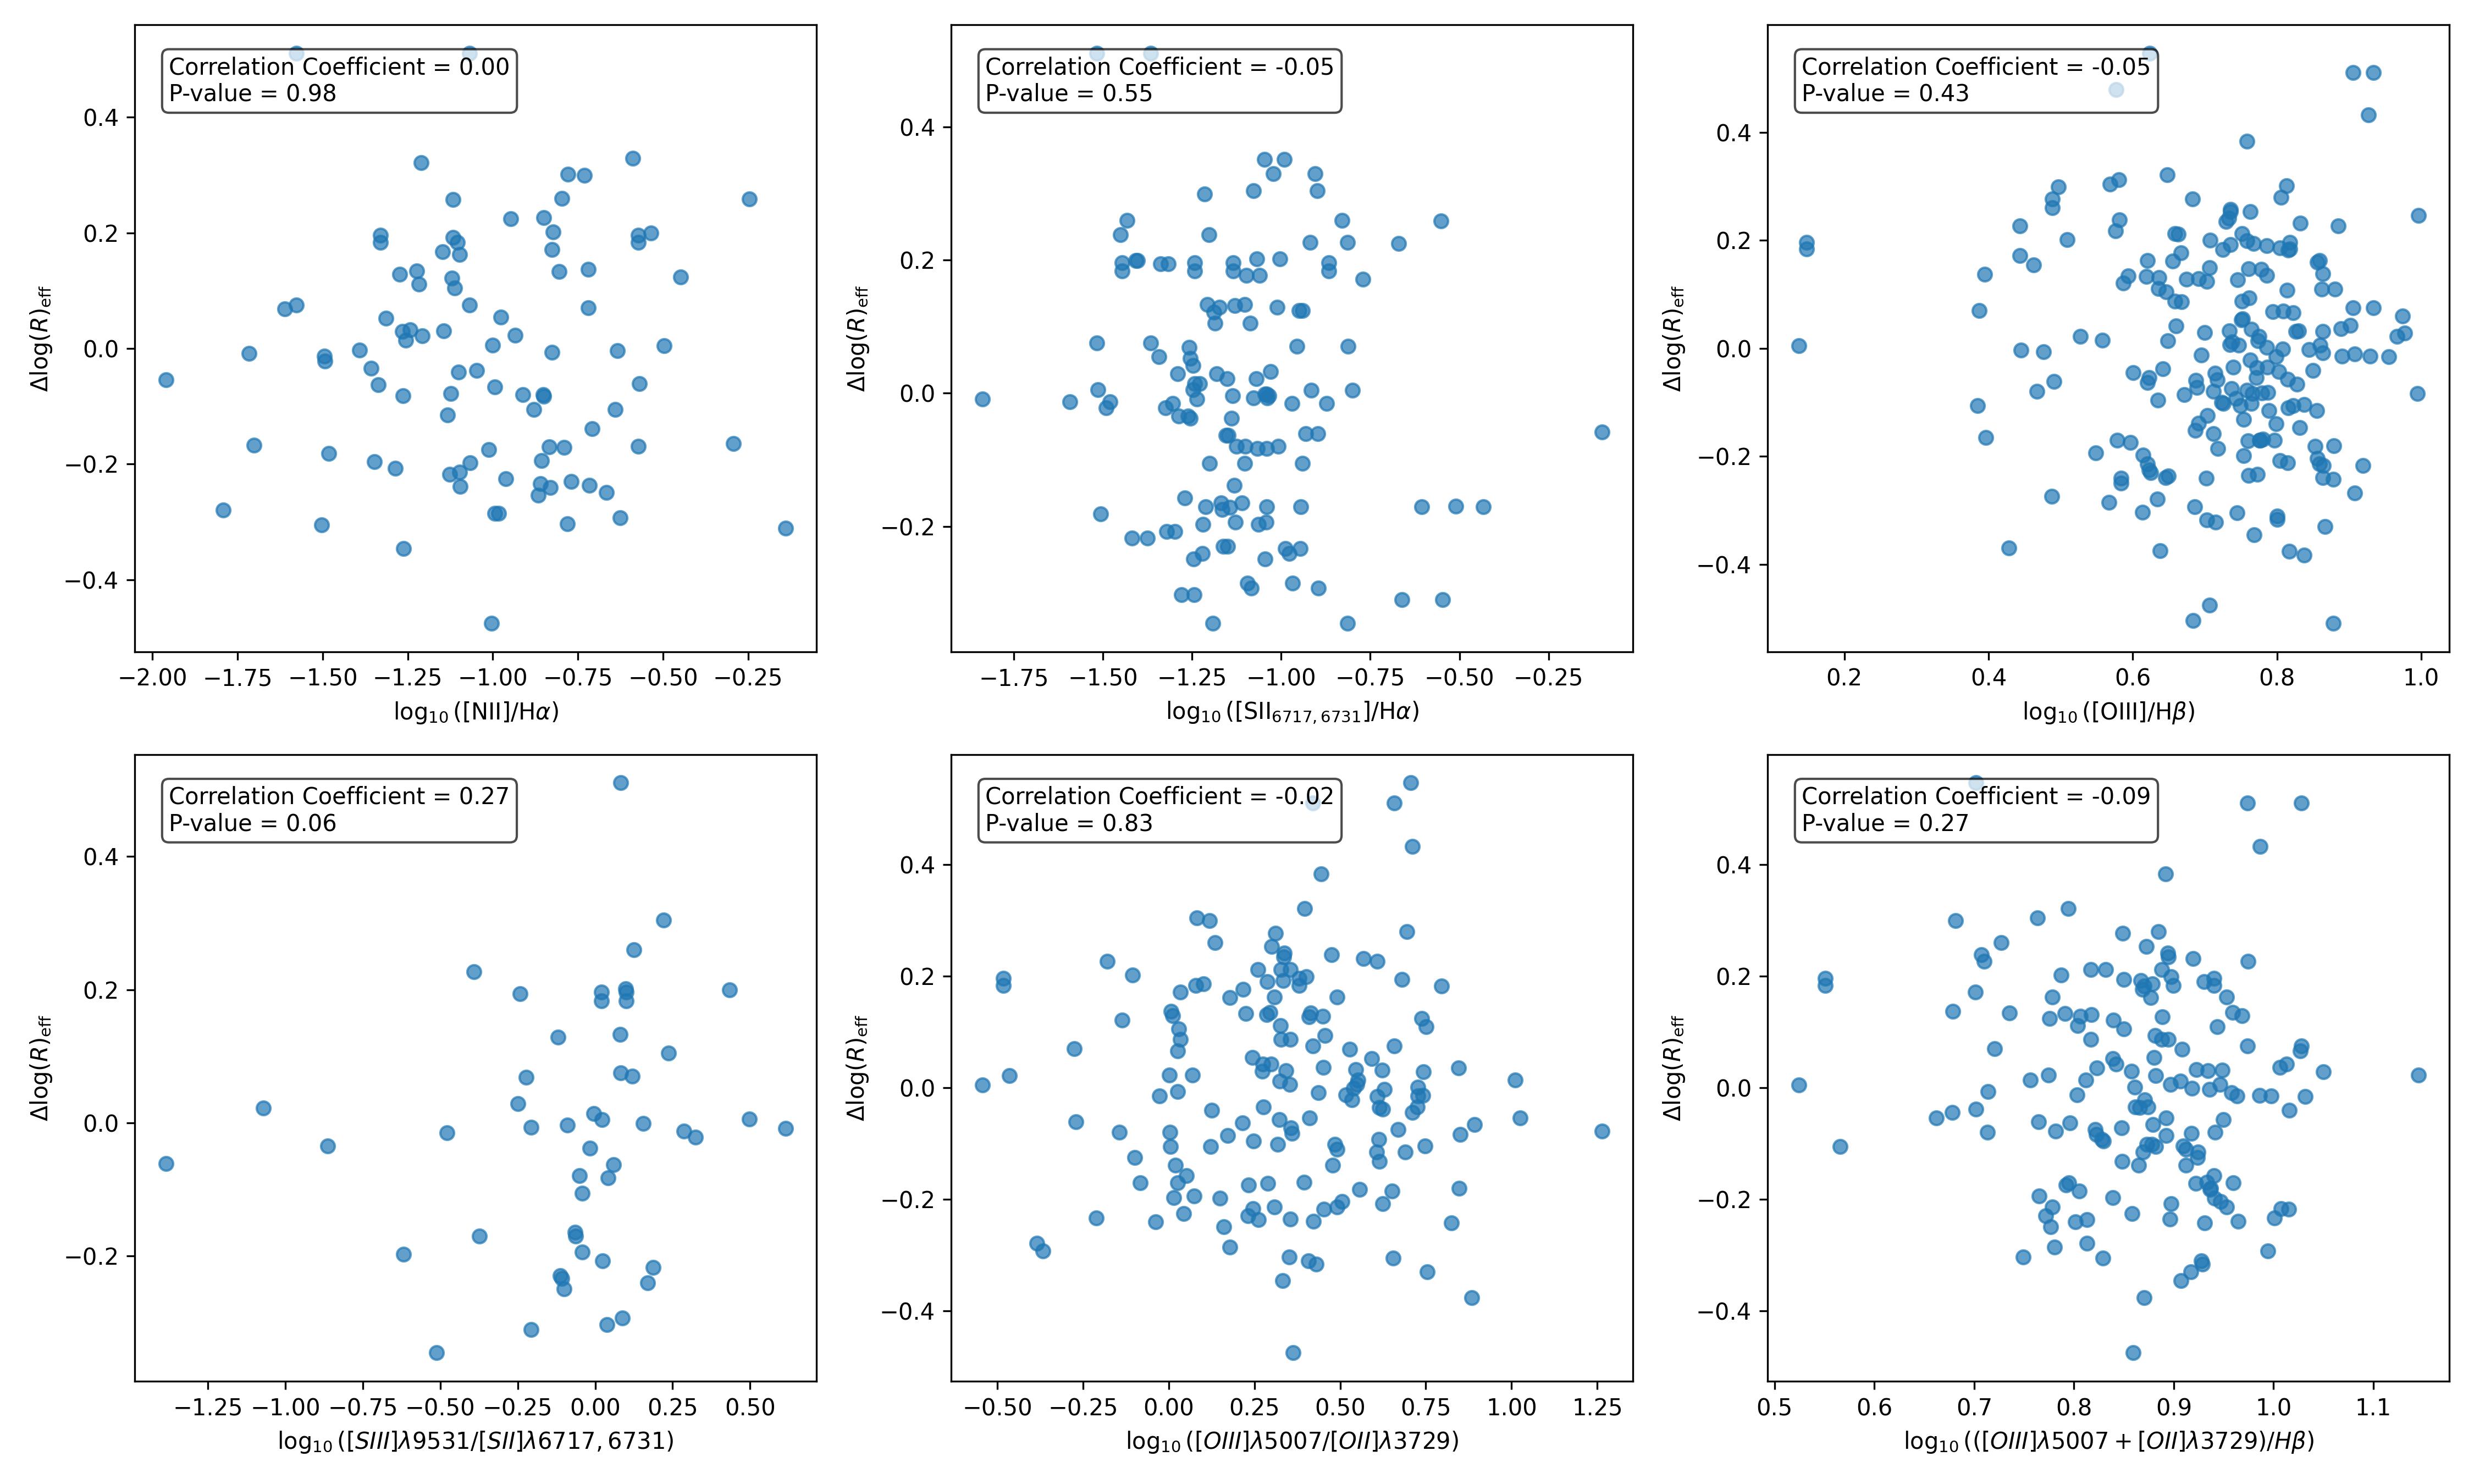
We then moved to compare each separate emission line ratio with its distribution of $\Delta log(r_{eff})$ values. We utilized Spearman tests to determine the significance of each relationship. These plots can be seen in Figure 3., and the results of these tests are summarized in \textit{Table 1.} These tests yielded insignificant results, with p-values ranging from 0.06-0.98.
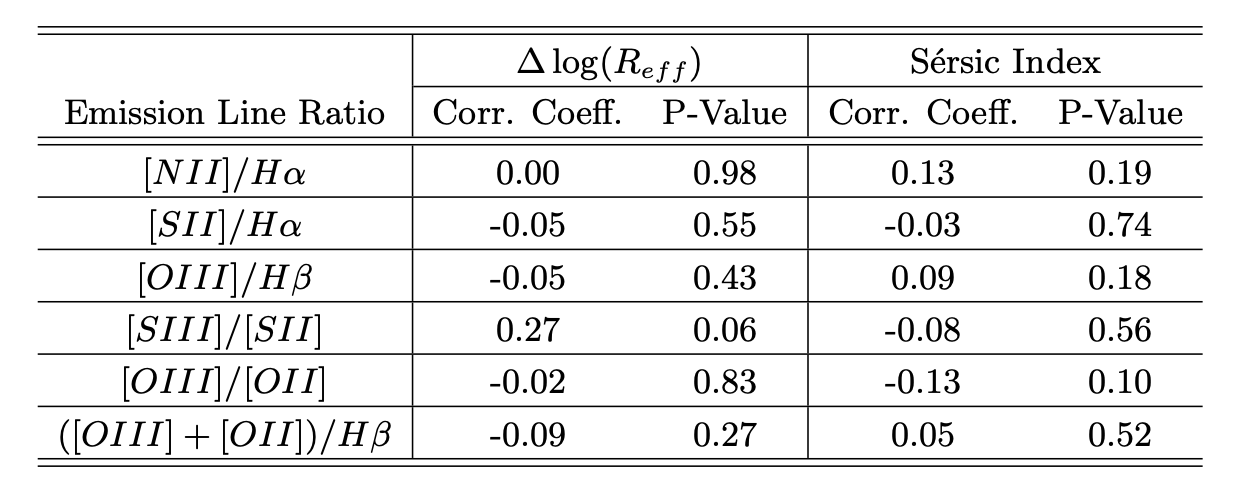
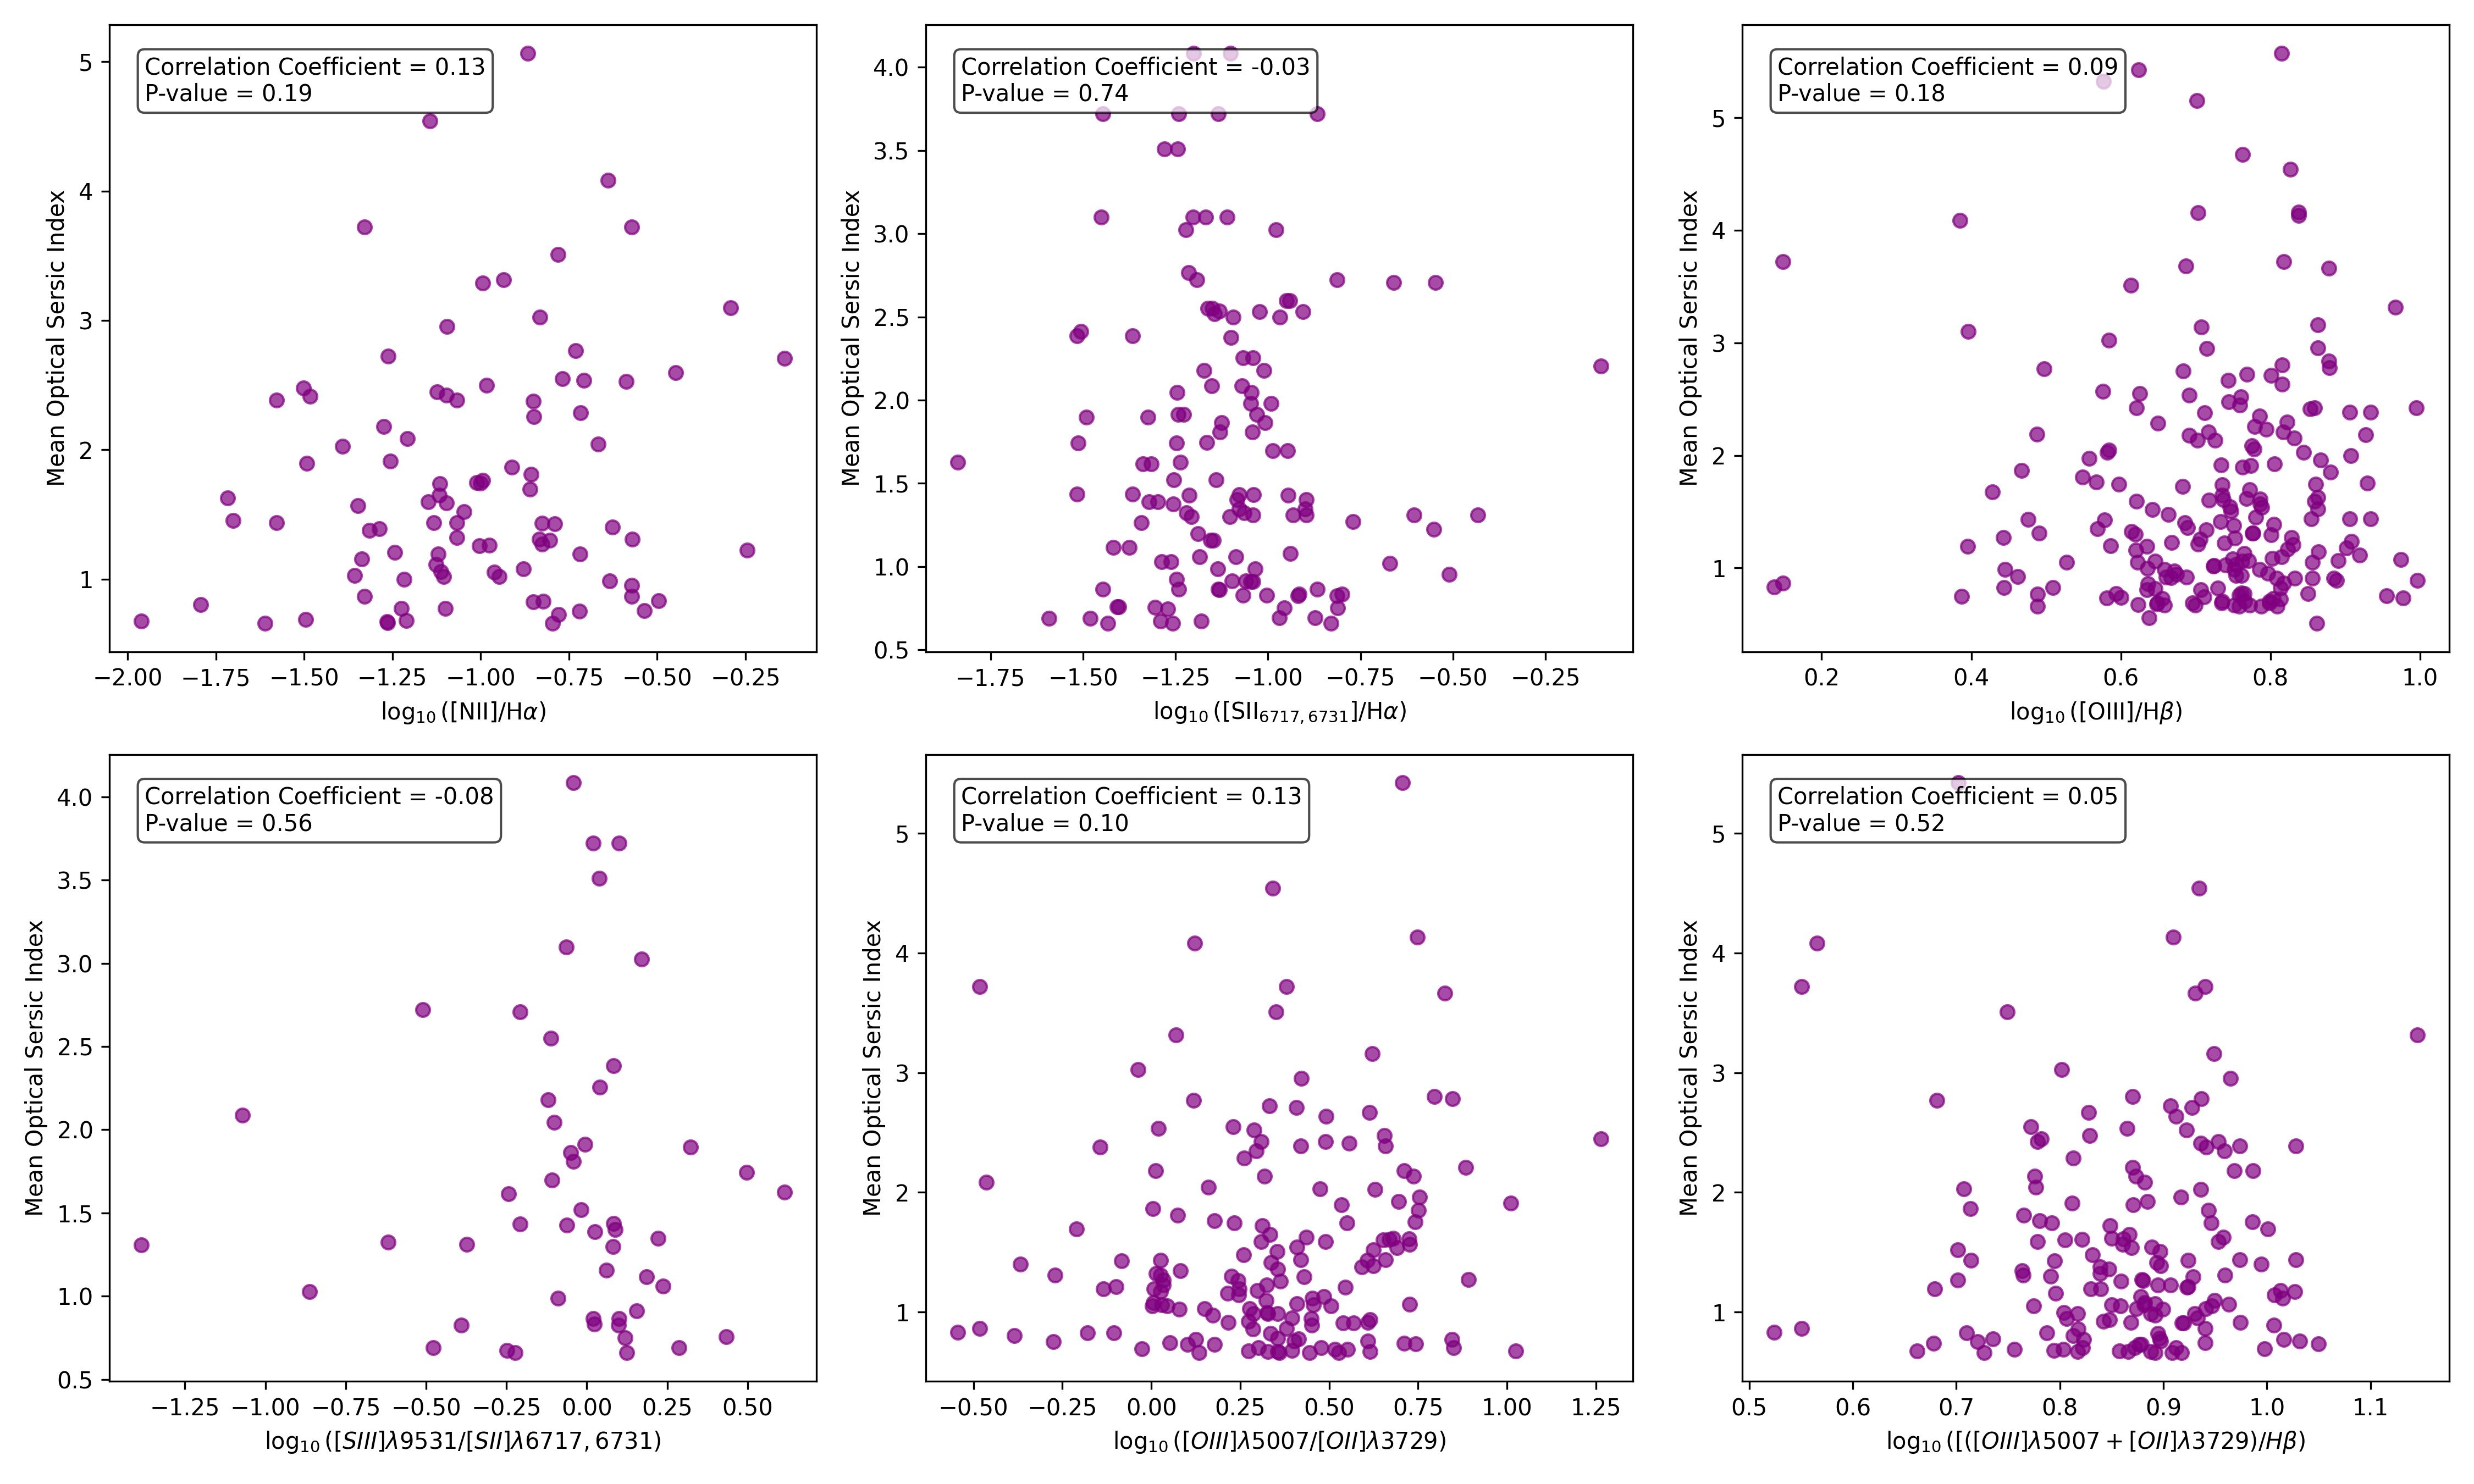
The second morphological feature we studied was each galaxy’s S'ersic index. As shown in Figure 4., we plotted each individual line ratio against the distribution of each galaxy’s mean optical S'ersic index. We again utilized Spearman tests to determine the significance of each relationship, and a summary of these results can be seen in \textit{Table 1.} No relationships between the mean optical S'ersic index and an emission line ratio were found to be significant.
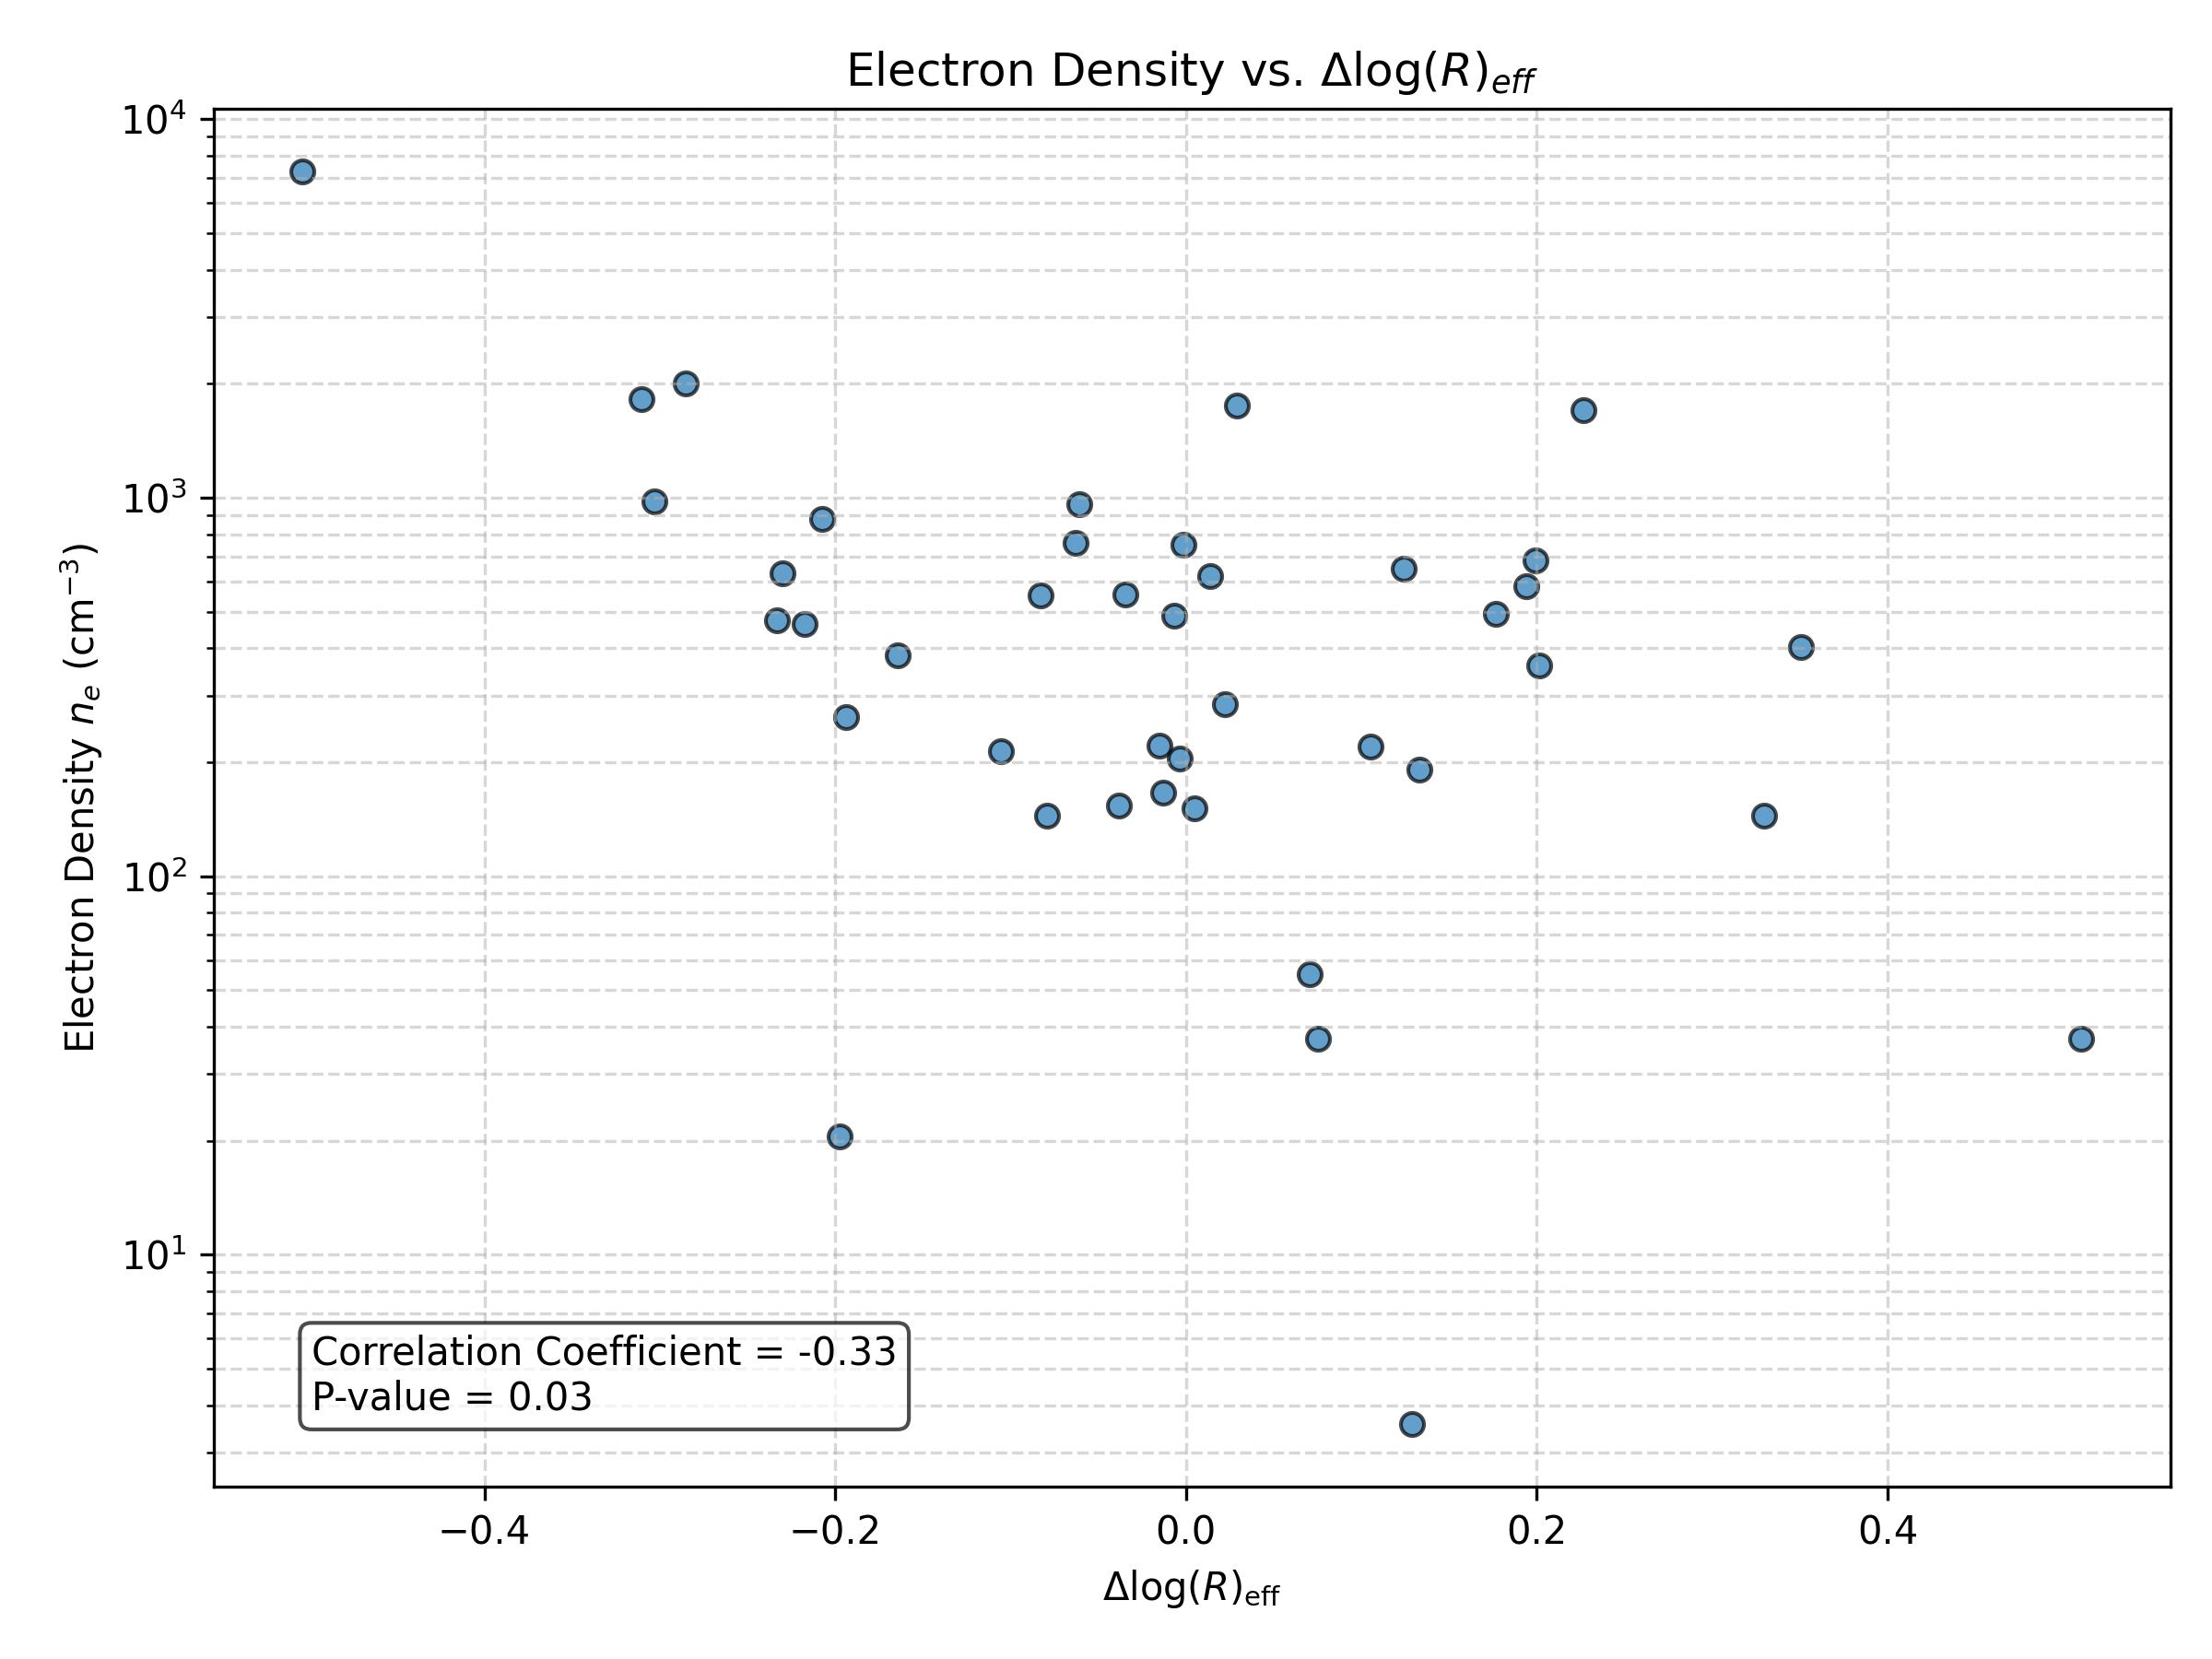
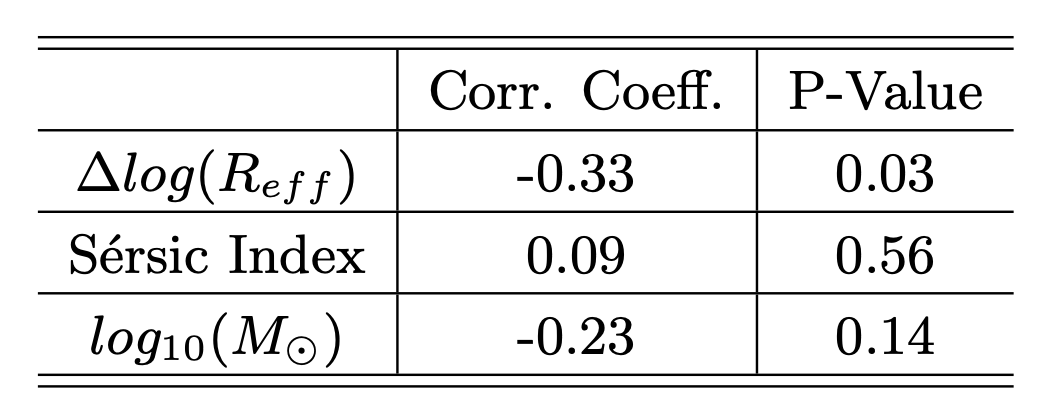
The final morphological feature we examined was the electron density $n_e$ of each galaxy. We utilized the PyNeb software \citep{pyneb} to calculate the electron density, inputting the $[SII]6731/[SII]6717$ emission line ratio for each galaxy and assuming a fixed electron temperature of 10,000 Kelvin. We then created plots comparing the relationship between each galaxy’s electron density and other morphological features, including the galaxy’s mass, $\Delta log(R_{eff})$, and S'ersic index. The plot showing electron density’s relationship with $\Delta log(R_{eff})$ is shown in Figure 5. A table summarizing the results of these tests s shown in \textit{Table 2.}
We find a statistically-significant negative relationship between the electron density of a galaxy and its $\Delta log(R_{eff})$. If we assume all the emission from a galaxy orginiates from HII regions, this result implies that the electron density decreases with increased galaxy size, implying that the HII regions in larger galaxies have lower electron densities. As previously shown, we do not see any affect of this lower elctron density on any other galaxy properties, such as the metallicity (demonstrated by BPT diagrams) and the ionization states of different elements.
Conclusion
Throughout this study, we compared the integrated flux of six emission line ratios to measured morphological measurements. We used spectroscopic and morphological data from the Dawn JWST Archive of galaxies z=2.55-3.7. We then used an SNR-based Gaussian emission line fitting method and chose the line with the highest SNR across all bands. Then, we fit S'ersic profiles to each galaxy, and interpolated this S'ersic value and $R_{eff}$ values to rest frame wavelengths. We fit a model to remove the confounding effects of mass and redshift and to isolate the effects of size. Last, electron density was calculated using the PyNeb software (V. Luridiana et al. 2015), and then emission line ratio diagrams, including BPT diagrams, were created and relationships between emission line galaxies and morphology were explored. We found a negative relationship between $\Delta log(R_{eff})$ and electron density.
Overall, most of the relationships we explored throughout this study did not yield significant correlations between morphology and emission line ratios. There are a few ways to interpret these results: first, it is possible that there is little correlation between the gas properties in HII regions and the overall morphology of galaxies. Another possibility is that we are simply not examining the “right” aspects of galaxies to find connections between the two. Interpreting the physical causes of emission lines is complicated because many galaxy properties contribute to these lines. Throughout this project, we took the approach of looking for morphological correlations with the observed emission line ratios, which is relatively simple to implement but can be complicated to interpret due to the aforementioned confounding effects. Future work in this project would be to use the individual emission lines measured throughout this study to do a more detailed calculation of the physical properties of the gas in these galaxies, rather than examining emission line ratios, and look for morphological correlations with these properties.
Acknowledgements
(Some of) The data products presented herein were retrieved from the Dawn JWST Archive (DJA). DJA is an initiative of the Cosmic Dawn Center (DAWN), which is funded by the Danish National Research Foundation under grant DNRF140.
This material is based upon work supported by the National Science Foundation (NSF) under Grant Numbers AST-2149425 and AST-2446392. Any opinions, findings, and conclusions or recommendations expressed in this material are those of the author(s) and do not necessarily reflect the views of the NSF.
References
Baldwin, J. A., Phillips, M. M., & Terlevich, R. 1981, PASP, 93, 5, doi: 10.1086/130766
de Graaff, A., Brammer, G., Weibel, A., et al. 2025, A&A, 697, A189, doi: 10.1051/0004-6361/202452186
Heintz, K. E., Watson, D., Brammer, G., et al. 2024, Science, 384, 890, doi: 10.1126/science.adj0343
Jakobsen, P., Herruit, P., Alves de Oliveira, C., et al. 2022, A&A, 661, A80, doi: 10.1051/0004-6361/202142663
Luridiana, V., Morisset, C., & Shaw, R. A. 2015, A&A, 573, A42, doi: 10.1051/0004-6361/201323152
Maiolino, R., & Mannucci, F. 2019, A&A Rv, 27, 3, doi: 10.1007/s00159-018-0112-2
Pasha, I., & Miller, T. B. 2023, Journal of Open Source Software, 8, 5703, doi: 10.21105/joss.05703
Sersic, J. L. 1968, Atlas de Galaxias Australes
Strom, A. L., Steidel, C. C., Rudie, G. C., et al. 2017, ApJ, 836, 164, doi: 10.3847/1538-4357/836/2/164
Vika, M., Vulcani, B., Bamford, S. P., Haubler, B., & Rojas, A. L. 2015, A&A, 577, A97, doi: 10.1051/0004-6361/201425174
Virtanen, P., Gommers, R., Oliphant, T. E., et al. 2020, Nature Methods, 17, 261, doi: 10.1038/s41592-019-0686-2